Mapping the Future: Introducing LoRaWAN Range Mapper v1.0
IoT
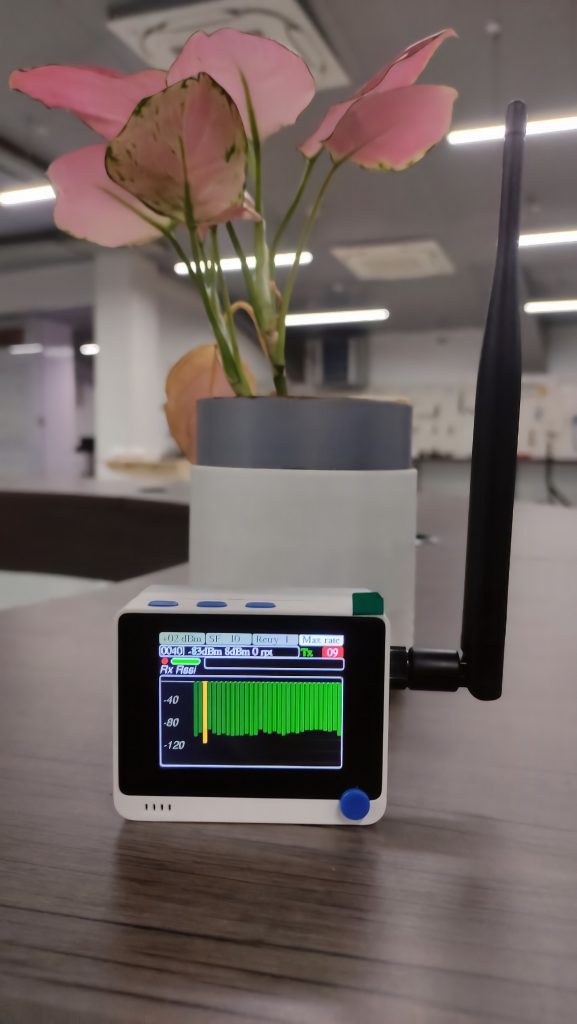
When embarking on the deployment of a LoRaWAN network, understanding your gateway coverage and assessing radio performance across various locations is paramount. A field tester becomes an invaluable asset in this endeavour, serving as a portable, user-friendly tool that aids in pinpointing optimal gateway locations and monitoring coverage within specific zones. As the Chirpstack network takes shape and GPS coordinates are meticulously mapped for visualization, the next logical step is to enhance network mappers by gaining insight into and sharing the real network coverage. This not only ensures the efficient operation of the LoRaWAN network but also facilitates the dissemination of accurate information to stakeholders, ultimately contributing to the network's effectiveness and success. This project plays a crucial role in determining the network coverage of a LoRaWAN network while also offering a comprehensive visualization of data through the mapping capabilities of the Grafana tool. By plotting network data on a map, this tool empowers users to precisely pinpoint areas of interest and assess their signal strength, as indicated by the received signal strength indicator (RSSI). This information is invaluable for network optimization and strategic sensor deployment. Armed with insights derived from the range mapper, users can confidently deploy sensors in areas that exhibit optimal network coverage, ensuring efficient data transmission and enhancing the overall effectiveness of their LoRaWAN network.
- tags: IoT
- Share This


